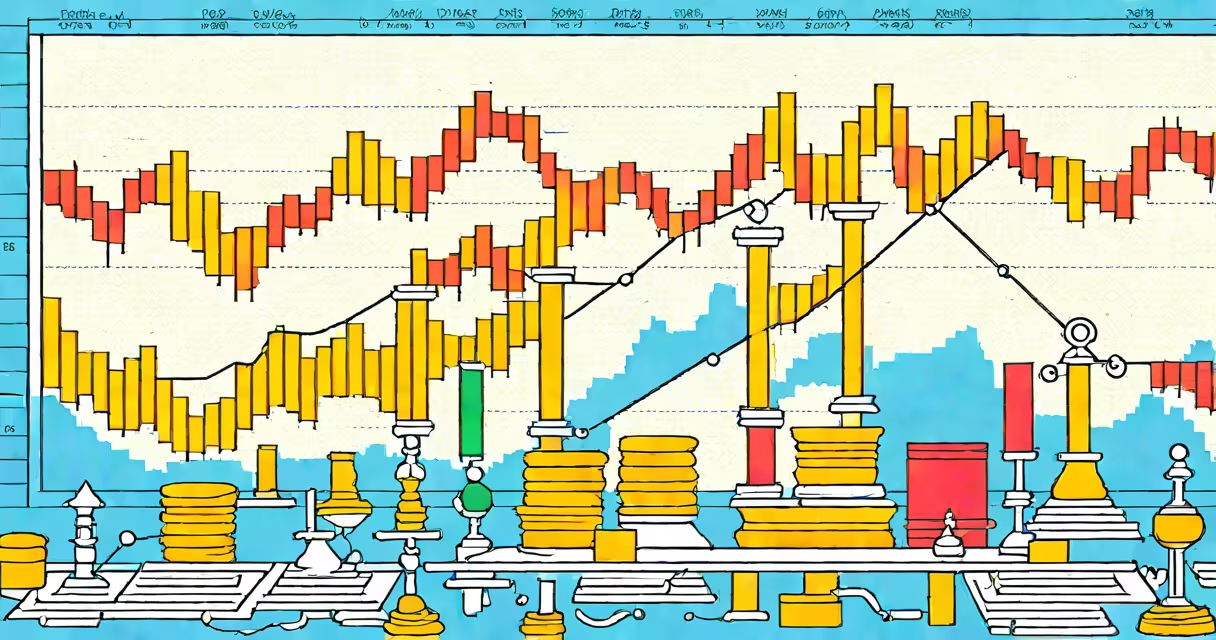
A bank nifty chart is a graphical representation of the Bank Nifty index, tracking the performance of major Indian banking stocks. It displays price movements, volume, and technical indicators to help traders analyze trends.
The chart plots historical and real-time data points, forming patterns that traders interpret using technical analysis tools. Common chart types include candlestick charts, line charts, and bar charts. Each type highlights different aspects of price action.
Bank Nifty charts come in several forms, each suited to different analytical needs:
Traders use bank nifty charts on platforms like TradingView and Zerodha Kite to make informed decisions. The charts help identify entry and exit points, set stop-loss orders, and implement strategies like scalping or swing trading. For example, a trader might notice a head-and-shoulders pattern on a candlestick chart, signaling a potential downturn.
Many traders confuse the Bank Nifty index with the broader Nifty 50. While both track Indian stocks, Bank Nifty focuses solely on banking and financial stocks, making it more volatile. Another mistake is relying solely on charts without considering fundamental factors like earnings reports or economic policies.
In early 2023, a bank nifty chart showed a steady uptrend with higher highs and higher lows. A trader using a moving average crossover strategy noticed the 50-day MA crossing above the 200-day MA, signaling a bullish trend. They entered a long position, profiting from the subsequent rise. However, when the chart formed a double top pattern, they exited, avoiding losses from the reversal.