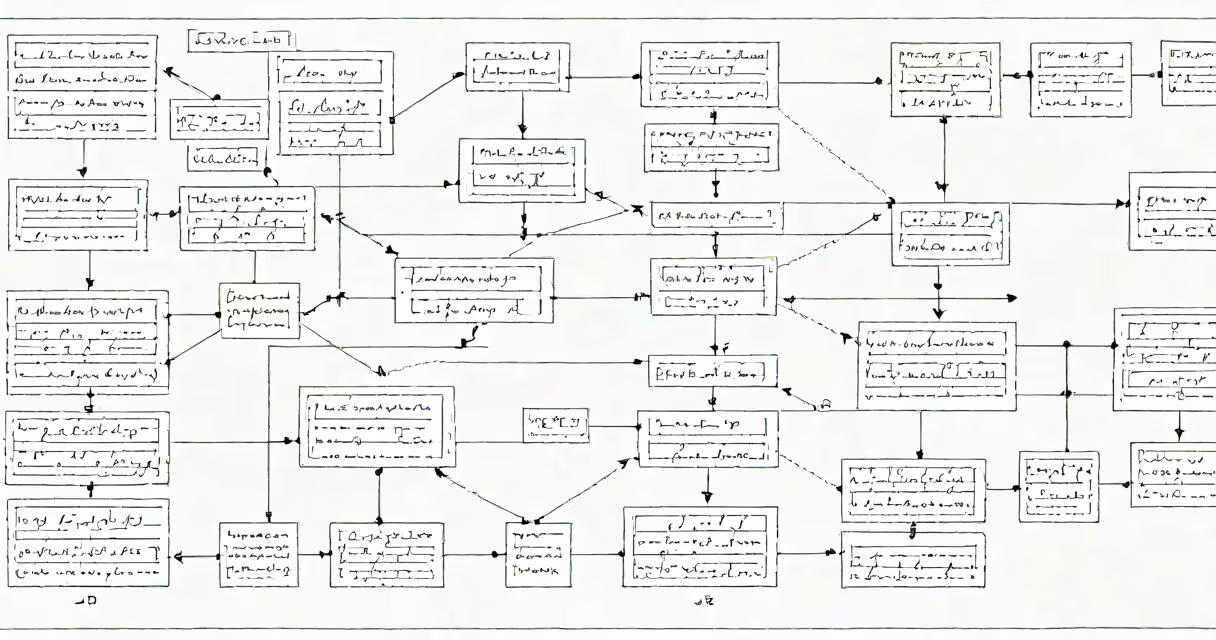
Structural equation modeling (SEM) is a statistical technique that combines factor analysis and multiple regression to analyze complex relationships between observed and latent variables.
SEM creates two models simultaneously: a measurement model that shows how observed variables relate to latent constructs, and a structural model that depicts relationships between latent variables. The software estimates parameters using maximum likelihood or other methods, then tests how well the model fits the data.
SEM consists of four key elements:
Researchers use SEM in social sciences, psychology, marketing, and biology to test theories about unobservable concepts. For example, a marketing study might use SEM to analyze how brand awareness (latent) affects purchase intent (observed) through multiple observed variables like ad recall and recognition.
| Feature | SEM | Traditional Regression |
|---|---|---|
| Handles measurement error | Yes | No |
| Tests complex relationships | Yes | Limited |
| Uses latent variables | Yes | td>No
Unlike traditional regression, SEM accounts for measurement error and can model indirect effects. While regression analyzes direct relationships between observed variables, SEM examines underlying latent constructs and their interrelationships.
Most researchers use specialized software like LISREL, Mplus, or AMOS to run SEM analyses. These programs provide diagrams to visualize relationships and fit indices to evaluate model performance.
When I analyzed customer satisfaction data for an e-commerce company, I used SEM to model how website usability (latent) affected satisfaction (observed) through multiple observed variables like ease of navigation and page load speed. The model revealed that usability had both direct and indirect effects on satisfaction, which helped prioritize website improvements.