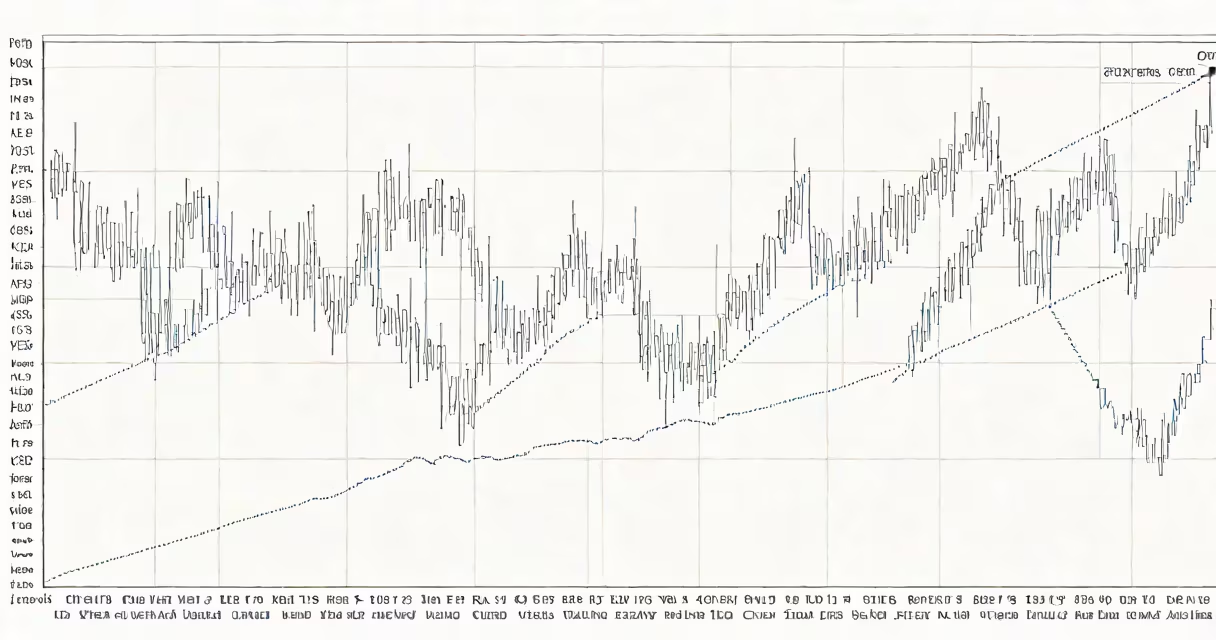
A CRSP stock chart visualizes the historical performance of index funds tracked by the Center for Research in Security Prices (CRSP) at the University of Chicago. These charts provide investors with precise, long-term data on market movements.
CRSP stock charts plot daily, monthly, or annual returns of specific indexes. The data spans decades, offering unique insights into market behavior. For example, the CRSP US Total Market Index includes thousands of stocks, providing a complete view of U.S. equity markets.
| Index Name | Coverage | Key Feature |
|---|---|---|
| CRSP US Total Market Index | All U.S. securities | Most complete U.S. market measure |
| CRSP Decile Indexes | Market-cap deciles | Tracks performance by size |
| CRSP Equal-Weighted Index | Equal-weighted portfolio | Balances small- and large-cap influence |
Investors rely on CRSP stock charts for benchmarking, research, and long-term strategy development. The data helps compare fund performance against market averages. For instance, a mutual fund manager might use CRSP charts to assess how their fund's returns stack up against the CRSP US Total Market Index over 20 years.
Academics and researchers also use CRSP data to study market efficiency, risk premia, and other financial theories. The longevity and consistency of CRSP data make it invaluable for empirical research.
Many confuse CRSP with the S&P 500, but CRSP indexes are broader and include smaller companies. While the S&P 500 tracks 500 large-cap U.S. stocks, CRSP indexes cover nearly all publicly traded U.S. equities, including micro-caps.
Another misconception is that CRSP data is only useful for academics. In reality, institutional investors and asset managers frequently use CRSP stock charts to evaluate fund performance and develop investment strategies.
Reading a CRSP stock chart involves understanding key components:
For example, a CRSP stock chart for the CRSP US Total Market Index might show a steady upward trend, with notable dips during market crashes like the 2008 financial crisis. Investors can use this data to identify long-term growth patterns and potential risks.
Each tool serves a unique purpose, and investors often use a combination of CRSP stock charts and company-specific charts to make informed decisions.