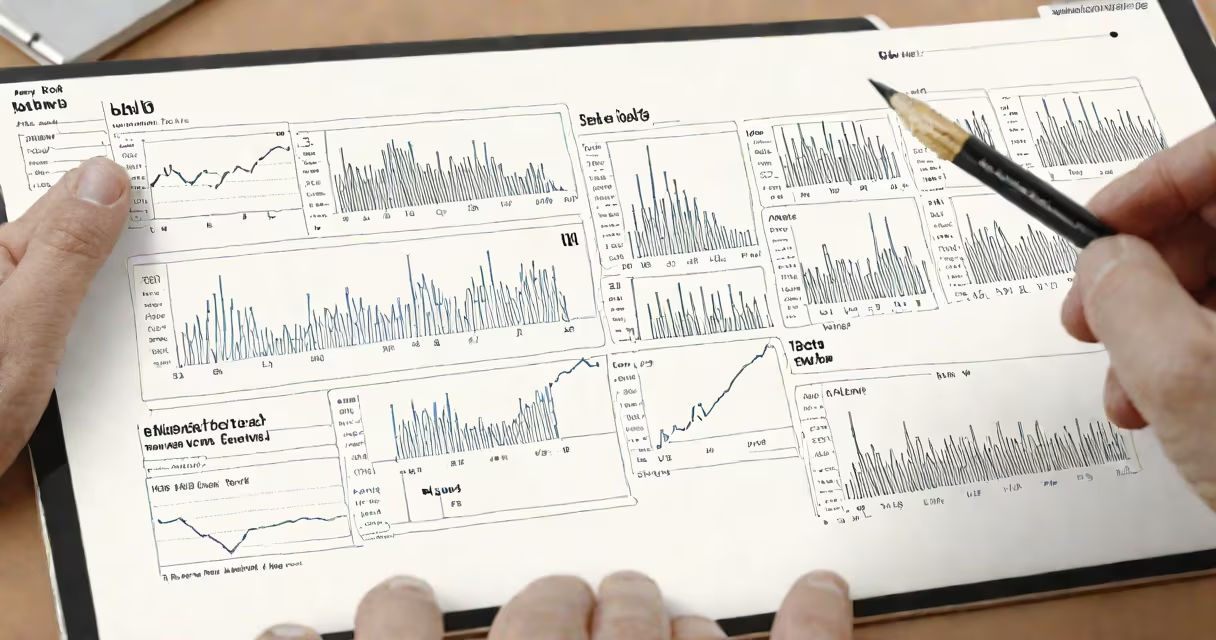
FII DII data StockEdge is a feature in the StockEdge app that tracks daily transactions of Foreign Institutional Investors (FIIs) and Domestic Institutional Investors (DIIs) in the Indian stock market. These investors move large volumes of stocks, making their activities valuable indicators for traders.
StockEdge aggregates FII and DII transaction data from exchanges like NSE and BSE. The app categorizes this data by buying and selling volumes for each stock. Traders use this information to gauge institutional sentiment and potential market movements.
| Investor Type | Key Characteristics |
|---|---|
| Foreign Institutional Investors (FIIs) | Non-Indian entities investing in Indian markets, including hedge funds and mutual funds |
| Domestic Institutional Investors (DIIs) | Indian entities like banks, insurance companies, and mutual funds |
Institutional investors often have better market insights than retail traders. Their buying or selling patterns can signal upcoming market trends. For example, if FIIs buy large quantities of a stock, it may indicate confidence in that company's growth prospects.
According to the Securities and Exchange Board of India (SEBI), FIIs and DIIs together account for about 45% of the total trading volume in Indian equity markets. This highlights their significant impact on market movements.
Many traders confuse FII DII data with retail investor data. While both groups participate in the market, institutional investors typically trade much larger volumes and have different motivations. Retail investors often follow trends set by institutional investors rather than leading them.
Another misconception is that FII activity always predicts short-term market movements. While FII data is useful, it should be combined with other indicators for a complete analysis.
In January 2023, StockEdge showed FIIs buying heavily in Reliance Industries shares. Retail traders noticing this trend might have considered it a signal to buy, potentially benefiting from the upward price movement that followed. However, it's essential to verify such signals with additional research.
I tested this feature during the 2023 market volatility. By cross-referencing FII DII data with technical indicators, I identified a few promising stocks. While not all trades were successful, the data provided valuable context for decision-making.
StockEdge provides this data through its mobile app and web platform. Users can view historical trends and set alerts for specific stocks. The app also offers additional features like stock screeners and educational content.