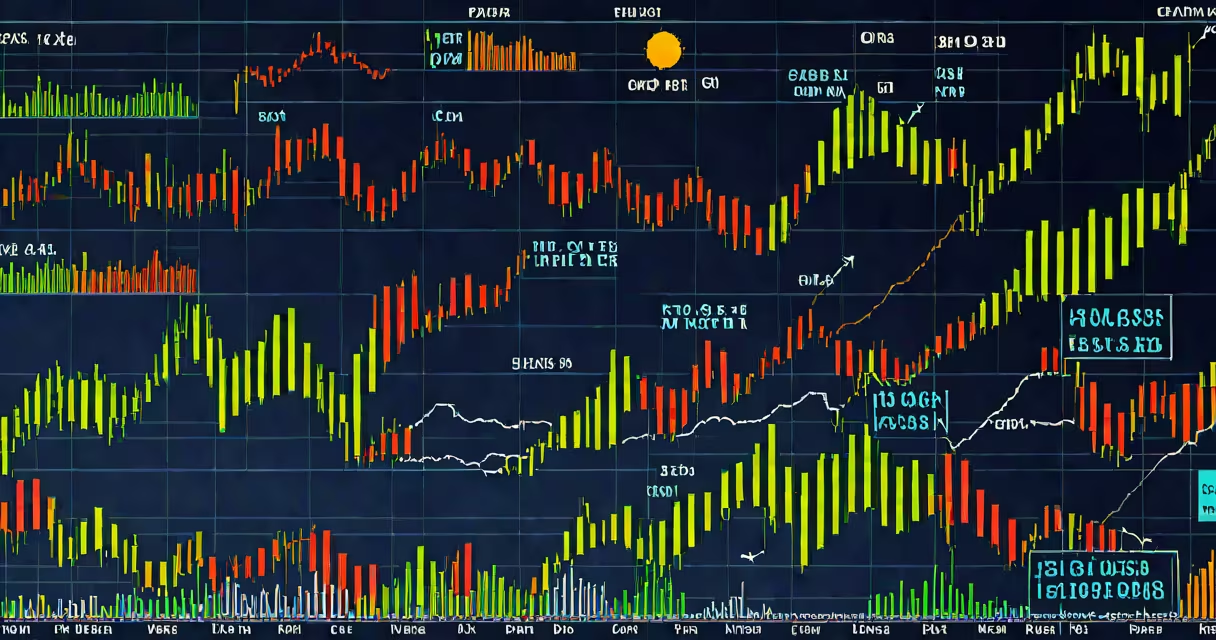
The stock market may be in trouble when key indicators show persistent declines, high volatility, and weak economic fundamentals. To determine this, compare current performance against historical averages and sector-specific benchmarks.
Markets fluctuate daily, but trouble becomes evident through sustained patterns. A declining trend over multiple months, combined with rising volatility, often signals deeper issues. For example, the S&P 500 dropping 20% or more from its recent peak typically marks a bear market.
Market troubles fall into three broad categories:
Trouble in the stock market affects retirement savings, business valuations, and economic confidence. Investors rely on indicators like the VIX (volatility index) and unemployment rates to gauge risk. For instance, the VIX spiking above 30 suggests heightened fear.
Many confuse normal volatility with systemic trouble. A single bad day doesn't indicate a crisis-context matters. The 2020 COVID-19 drop was severe but brief, unlike the 2008 financial crisis, which lasted over a year.
In early 2022, the NASDAQ dropped 28% from its November 2021 peak. While this met the bear market definition, it recovered by mid-2023 as inflation eased. Historical data shows such rebounds are common after corrections.