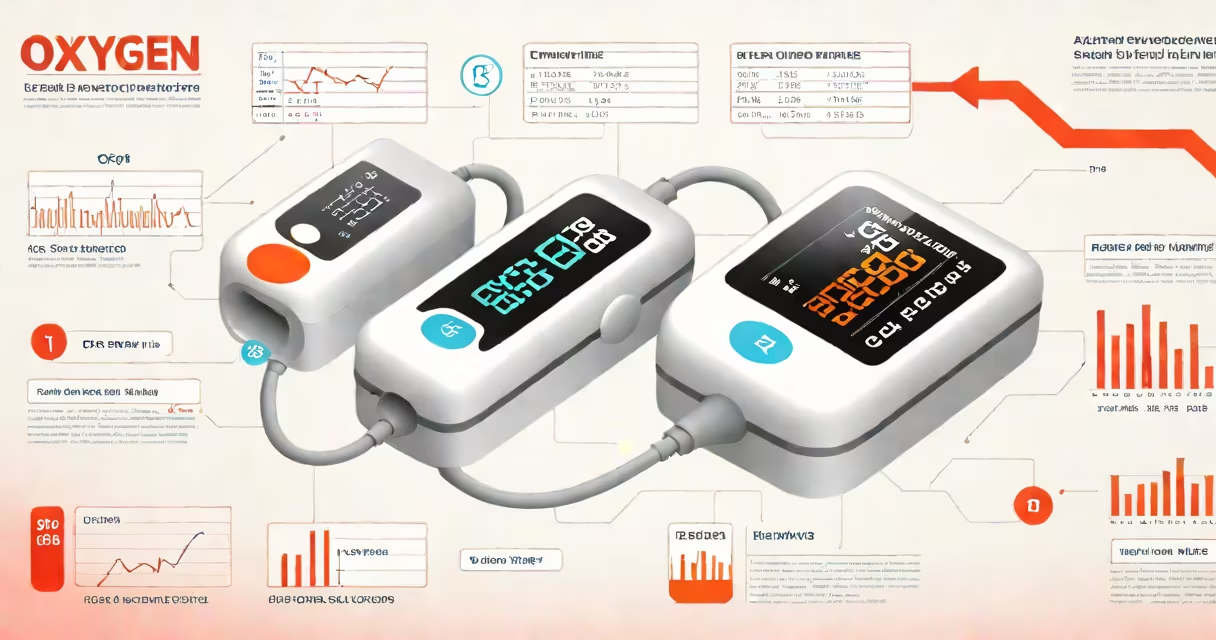
An oxygen blood saturation chart displays normal, low, and dangerously low SpO2 levels measured by a pulse oximeter. These charts help identify when oxygen levels may require medical attention.
A pulse oximeter clips onto a finger, toe, or earlobe and uses light to measure how much oxygen is in the blood. The device provides a reading called SpO2, which stands for peripheral capillary oxygen saturation. This measures the percentage of hemoglobin molecules carrying oxygen compared to those not carrying oxygen.
Oxygen saturation levels are typically categorized into three ranges:
| SpO2 Level | Classification | Action Required |
|---|---|---|
| 95%-100% | Normal | No action needed |
| 91%-94% | Low | Monitor closely |
| Below 90% | Dangerously Low | Seek immediate medical attention |
Oxygen saturation is important because it indicates how well the body is delivering oxygen to important organs. Low oxygen levels can lead to serious health issues, including organ damage or failure. Conditions such as chronic obstructive pulmonary disease (COPD), asthma, and pneumonia can affect oxygen saturation.
Many people believe that a reading of 100% is always ideal. However, readings above 95% are generally considered normal., some individuals may have slightly lower baseline oxygen levels due to conditions like chronic lung disease. It's essential to consult with a healthcare provider to understand personal baseline levels.
For most healthy individuals, maintaining oxygen saturation levels between 95% and 100% is ideal. Regular monitoring, especially for those with respiratory conditions, can help ensure timely medical intervention when needed.