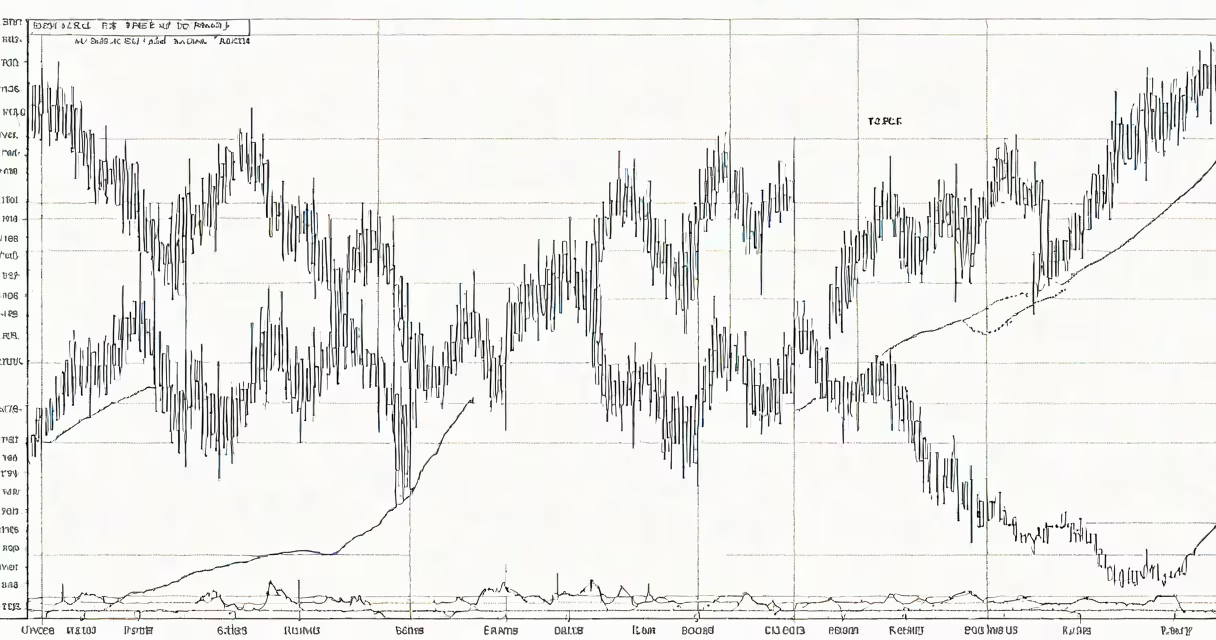
A USD JPY forex chart displays the historical and real-time exchange rate between the U.S. dollar (USD) and Japanese yen (JPY), tracking their relative value in the foreign exchange market.
These charts plot price data over time, typically using candlestick or line graphs. Each data point represents the exchange rate at a specific moment, with candlesticks showing open, high, low, and close prices for given periods. The y-axis shows the exchange rate value, while the x-axis represents time intervals ranging.
| Chart Type | Description | Common Timeframes |
|---|---|---|
| Line Chart | Connects closing prices with a continuous line | Daily, weekly, monthly |
| Candlestick Chart | Shows open, high, low, and close prices as rectangular bars | 1 minute to 4 hours |
| Bar Chart | Similar to candlesticks but uses vertical lines | Hourly to daily |
Traders analyze these charts to identify patterns, trends, and potential trading opportunities. The USD/JPY pair is particularly sensitive to interest rate differentials between the U.S. Federal Reserve and Bank of Japan, making it popular among macroeconomic traders. Technical analysts use indicators like moving averages, RSI, and MACD on these charts to make informed trading decisions.
For example, during the 2022 U.S. interest rate hikes, the USD/JPY pair rose from around 115 to 150 as the yield differential widened. Traders monitoring the forex chart would have seen this upward trend develop and could have capitalized on it.
Many traders confuse the USD/JPY pair with other yen crosses like EUR/JPY or GBP/JPY. While these pairs share the yen as their quote currency, they behave differently due to varying correlations with their base currencies., some believe forex charts predict future prices, but they actually show historical data that traders interpret to make educated guesses about potential future movements.
I once observed a trader mistakenly analyzing a EUR/JPY chart when they intended to trade USD/JPY. This led to poor performance because the price drivers for these pairs differ. Always verify you're looking at the correct currency pair before making trading decisions.
Different timeframes reveal different aspects of market behavior. Short-term charts (minutes to hours) show intraday volatility and are useful for scalping strategies. Medium-term charts (daily to weekly) reveal trends and are favored by swing traders. Long-term charts (monthly to yearly) show the big picture and are used by position traders and investors.
A common mistake is focusing solely on short-term charts while ignoring longer-term trends. For instance, a trader might see a brief downward movement on a 1-hour chart and sell, unaware that the daily chart shows a strong uptrend that's likely to continue.