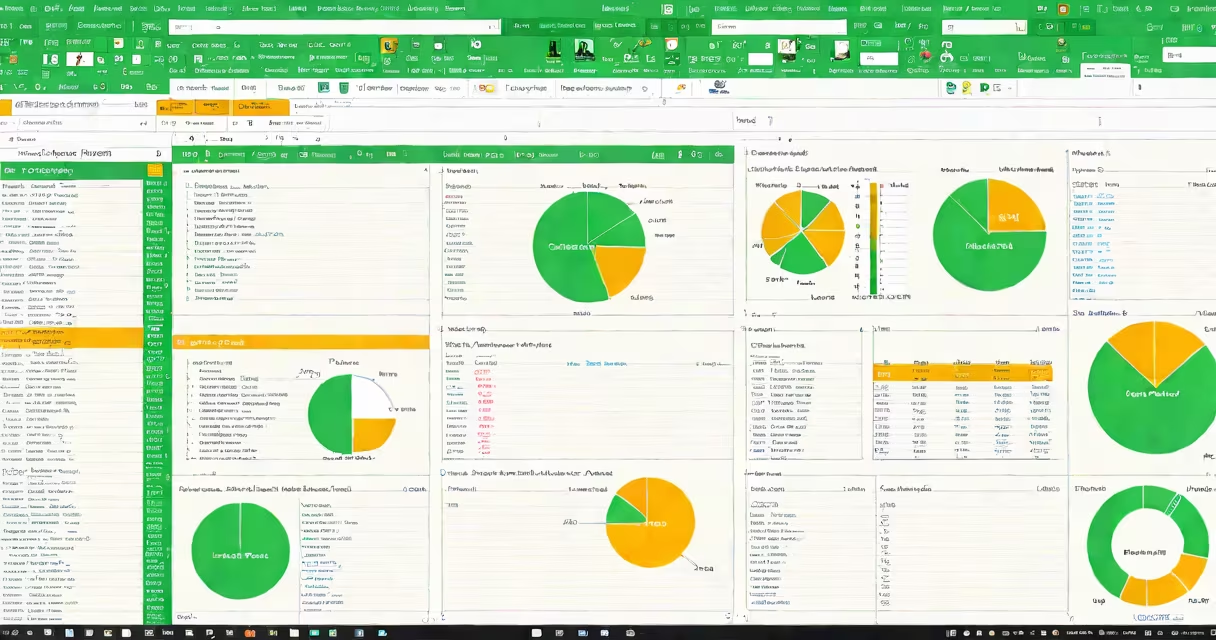
Microsoft Excel is a spreadsheet program for organizing, analyzing, and visualizing data using formulas, functions, and charts. It is part of the Microsoft Office set and widely used in business, finance, and academia.
Excel stores data in cells arranged in rows and columns, forming a grid. Each cell can contain numbers, text, or formulas. Formulas begin with an equals sign (=) and perform calculations using cell references, constants, and functions. For example, =SUM(A1:A10) adds the values in cells A1 through A10.
| Function | Description | Example |
|---|---|---|
| SUM | Adds a range of cells | =SUM(A1:A10) |
| AVERAGE | Calculates the average of a range | =AVERAGE(B1:B10) |
| IF | Performs a logical test | =IF(A1>90,"Pass","Fail") |
| VLOOKUP | Searches for data in the first column of a table | =VLOOKUP(A1,Table1,2,FALSE) |
Businesses use Excel for budgeting, forecasting, and tracking expenses. Academics use it for statistical analysis and research. Personal users manage budgets, track investments, and organize schedules. Excel's pivot tables allow users large datasets efficiently.
To begin using Excel, open the application and enter data into cells. Use the formula bar to input formulas and functions. Excel's ribbon interface provides access to tools for formatting, chart creation, and data analysis. Practice with simple tasks like creating a budget or tracking expenses to build confidence.
I once used Excel to manage a project timeline, tracking deadlines and milestones with conditional formatting to show overdue tasks. This helped my team stay organized and meet our goals efficiently.