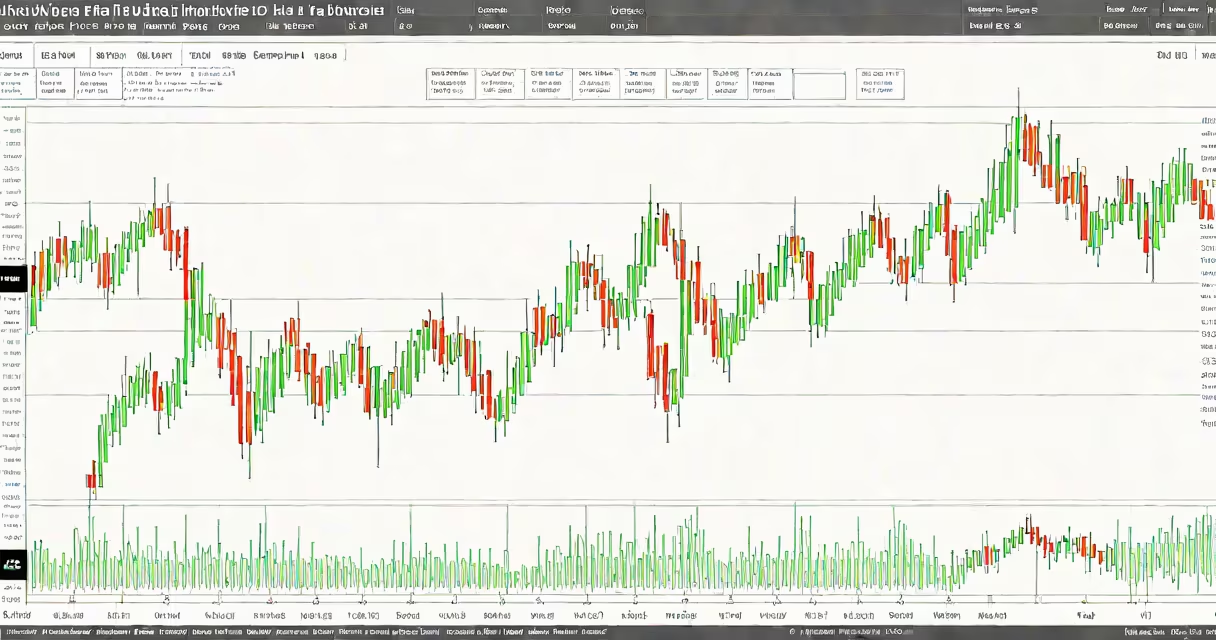
The average true range indicator (ATR) is a technical analysis tool measuring market volatility by calculating the average of true ranges over a specified period. Traders use it to set stop-loss orders and identify potential breakouts.
ATR calculates the true range (TR) for each period, which is the greatest of:
These TR values are then averaged over a chosen time frame, typically 14 periods. The result shows volatility as a numerical value, not direction.
| Application | Example |
|---|---|
| Stop-Loss Placement | A trader might set a stop-loss at 1.5 times the ATR value below the entry price |
| Breakout Confirmation | When price moves beyond recent highs/lows by more than the ATR value, it may signal a breakout |
| Trend Strength | Rising ATR during an uptrend suggests strengthening momentum |
Many traders mistakenly believe ATR predicts price direction. However, it only measures volatility. For example, a rising ATR during a downtrend doesn't necessarily mean prices will reverse - they might simply be falling faster.
Another misconception is that ATR works best in trending markets. While useful there, it's equally valuable in ranging markets to identify potential breakouts when volatility expands.
When analyzing a stock trading between $50-$52 with an ATR(14) of $0.75, a trader might:
I've used ATR to manage risk in volatile small-cap stocks. During earnings season, ATR values often double, allowing for wider stop-loss placement while maintaining position size relative to account risk.