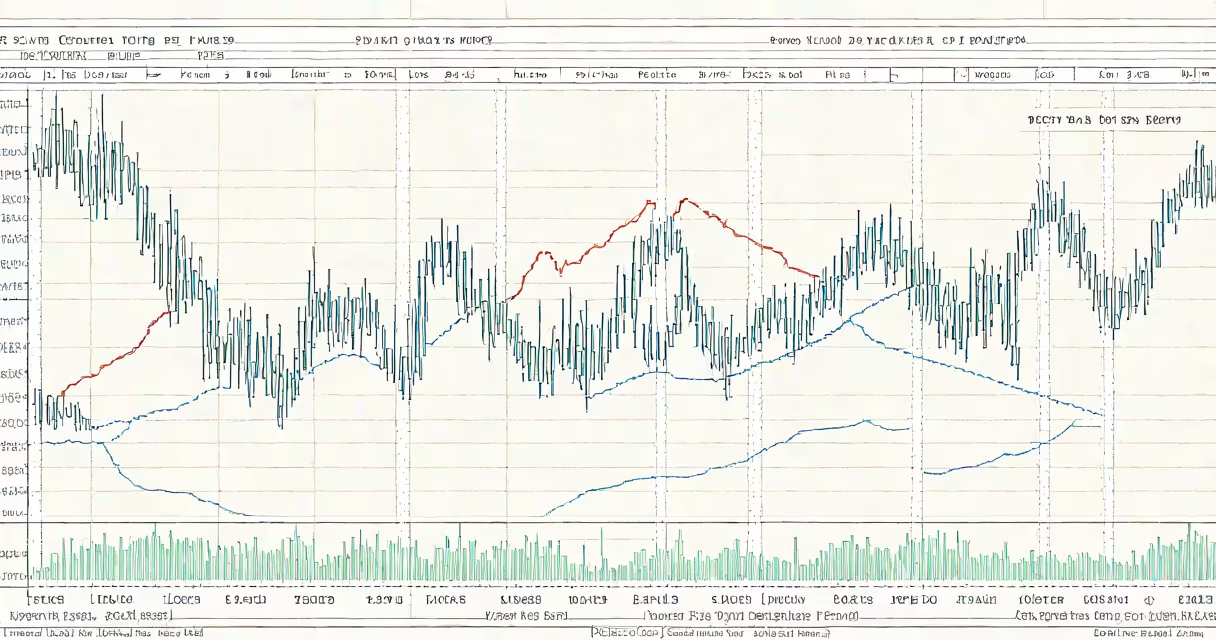
The Dow Jones Industrial Average 50-year chart tracks the price-weighted performance of 30 large U.S. companies. This long-term view reveals how the DJIA has navigated recessions, bull markets, and global crises.
The chart displays the DJIA's closing prices adjusted for splits and dividends. The vertical axis represents points (not dollar values), while the horizontal axis marks time in years. Key milestones appear as peaks and troughs corresponding to economic events.
The 50-year chart includes:
Long-term investors analyze the 50-year chart to identify patterns and assess the DJIA's resilience. For example, the chart shows the index recovered from every major downturn, including the 1973-74 bear market and the 2008 financial crisis. According to Investopedia, the DJIA has averaged annual returns of about 7% since its creation.
Many assume the DJIA represents the entire U.S. market, but it only tracks 30 stocks. Unlike the S&P 500, the DJIA is price-weighted, meaning higher-priced stocks have more influence. For instance, UnitedHealth Group's $500+ share price carries more weight than lower-priced components.