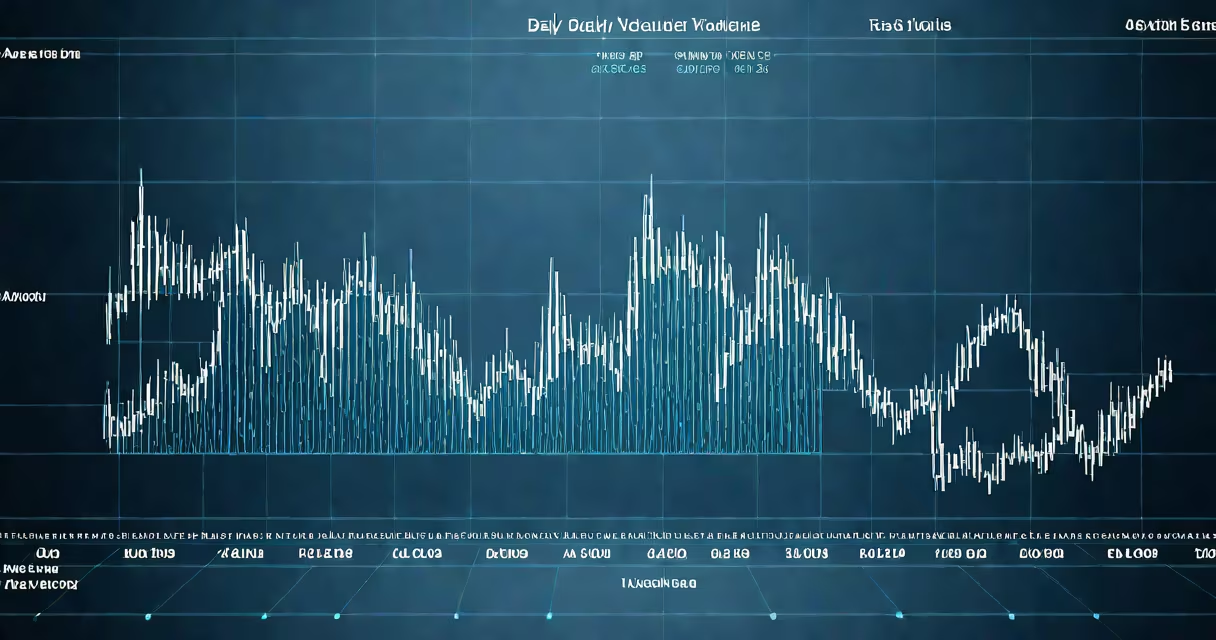
Average daily trade volume (ADTV) measures the average number of shares traded per day over a specific period, typically 30 or 60 days. This metric indicates liquidity and investor interest in a stock or market.
ADTV is calculated by summing the daily trading volumes over a set period and dividing by the number of trading days in that period. For example, if a stock traded 1 million shares on Monday, 1.2 million on Tuesday, and 900,000 on Wednesday, the 3-day ADTV would be 1 million shares.
| Type | Description | Example |
|---|---|---|
| Daily Volume | Shares traded in a single day | 1.5 million shares |
| Average Daily Trade Volume | Average shares traded over a period | 1.2 million shares (30-day average) |
| Relative Volume | Current volume compared to ADTV | 2x ADTV |
ADTV helps traders assess liquidity and potential price movements. High ADTV suggests strong investor interest and easier entry/exit points. For instance, a stock with an ADTV of 5 million shares is generally more liquid than one with 500,000 shares.
Traders often compare current volume to ADTV using relative volume (RVOL). An RVOL of 2x means twice the usual trading activity, which may indicate a significant event or trend.
Some traders confuse ADTV with daily volume or assume higher volume always means a better stock. However, extremely high volume can also signal panic selling or a potential downturn., ADTV varies by market cap: large-cap stocks typically have higher ADTV than small-cap stocks.
During the COVID-19 market volatility in March 2020, many stocks saw their ADTV surge. For example, Tesla's ADTV jumped from around 15 million shares in February to over 40 million in March. This spike reflected heightened investor interest and uncertainty.
Understanding ADTV helped traders go through the turbulence. Those who recognized the increased liquidity could enter or exit positions more easily, while others used the metric to identify overbought or oversold conditions.