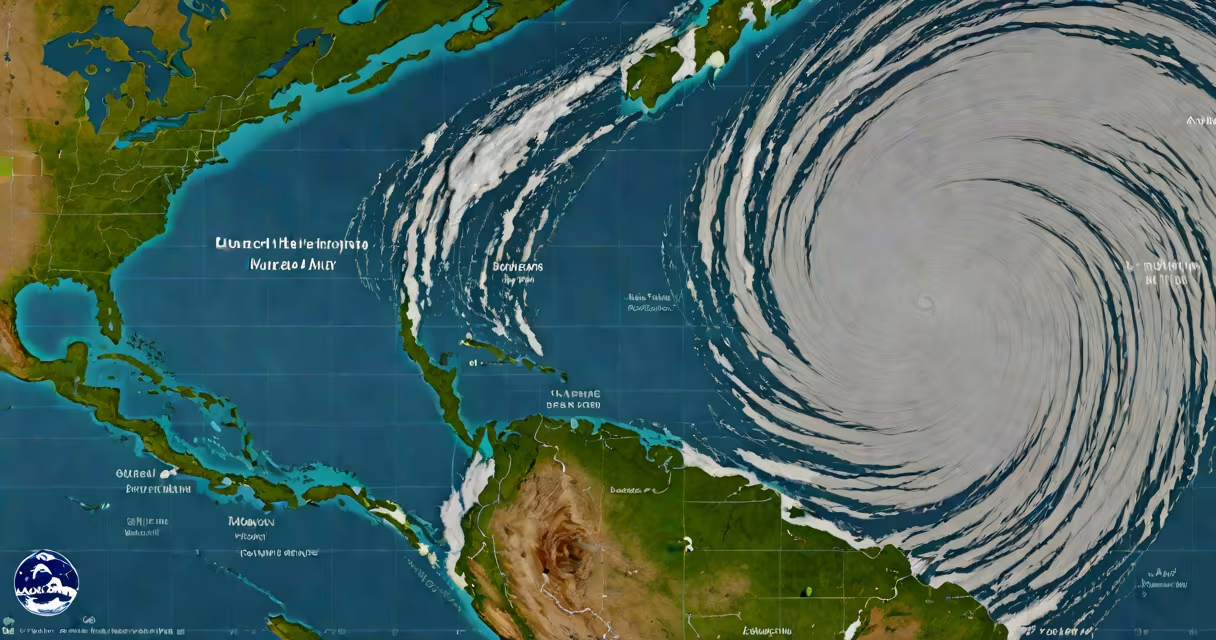
A NOAA hurricane map is a real-time tracking tool that displays the paths, intensities, and forecasts of tropical cyclones, including hurricanes and tropical storms. The National Oceanic and Atmospheric Administration (NOAA) updates these maps continuously during the Atlantic and Pacific hurricane seasons.
The map integrates data from satellites, aircraft reconnaissance, and weather stations to provide accurate storm predictions. The National Hurricane Center (NHC), part of NOAA, uses this data to generate forecasts, including projected paths, wind speeds, and arrival times. These forecasts help emergency managers, meteorologists, and the public prepare for potential impacts.
The map includes several key elements:
Emergency management agencies, meteorologists, and the public rely on the NOAA hurricane map to make informed decisions. For example, during Hurricane Ian in 2022, the map helped Florida residents evacuate ahead of the storm's landfall, reducing casualties. The NHC updates the map every six hours during active storms, providing timely information for decision-making.
Some people confuse the NOAA hurricane map with private weather apps or social media forecasts. Unlike these sources, the NOAA map is based on rigorous scientific data and government-backed expertise. Another mistake is assuming the map shows only hurricanes-it also tracks tropical storms and depressions, which can still cause significant damage.
During Hurricane Irma in 2017, I monitored the NOAA hurricane map closely. The real-time updates allowed me to track the storm's shifts in direction and adjust preparations accordingly. Seeing the map's accuracy firsthand reinforced its importance for safety planning.
The NOAA hurricane map is an essential tool for tracking tropical cyclones, providing critical data to protect lives and property. By understanding its features and limitations, users can better prepare for storms and stay informed during hurricane season.