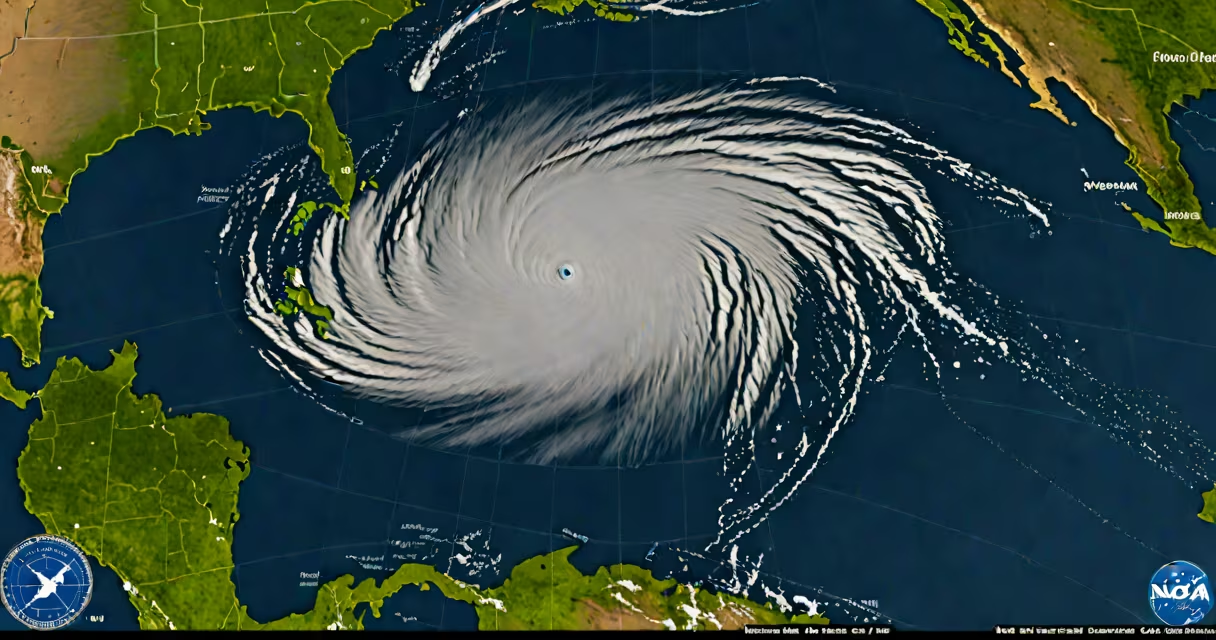
The NOAA Hurricane Center map is a real-time tracking tool that displays the current location and projected path of tropical cyclones, including hurricanes and tropical storms. This map, maintained by the National Hurricane Center (NHC), combines satellite imagery, radar data, and computer models to provide accurate forecasts.
The map integrates multiple data sources to create a complete picture of a storm's behavior. Satellite images show cloud patterns, while radar data reveals precipitation intensity. Computer models simulate the storm's future movement based on atmospheric conditions. The NHC updates the map every six hours during active storms, with special updates issued as needed.
For example, during Hurricane Ian in 2022, the NOAA Hurricane Center map showed the storm's rapid intensification as it approached Florida. The map's cone of uncertainty helped residents understand the range of possible landfall locations, allowing for timely evacuations.
The map includes several key elements:
| Storm Type | Wind Speed | Potential Impact |
|---|---|---|
| Tropical Depression | Less than 39 mph | Minimal damage, heavy rain |
| Tropical Storm | 39-73 mph | Moderate damage, power outages |
| Category 1 Hurricane | 74-95 mph | Some damage, especially to trees and power lines |
| Category 2 Hurricane | 96-110 mph | Considerable damage, roof and siding damage |
| Category 3 Hurricane | 111-129 mph | Devastating damage, structural damage to buildings |
| Category 4 Hurricane | 130-156 mph | Severe damage, most trees snapped or uprooted |
| Category 5 Hurricane | 157+ mph | Catastrophic damage, complete roof failure on many homes |
Many people mistake the cone of uncertainty for the actual forecast path. In reality, it represents the range of possible paths the storm could take. For instance, during Hurricane Sandy in 2012, the cone was wide, indicating significant uncertainty about the storm's path, which led to unexpected impacts in the Northeast.
Another misconception is that the map shows only the storm's center. In fact, dangerous conditions like storm surge, heavy rain, and high winds can extend far beyond the center. The NOAA Hurricane Center map includes watches and warnings to show these broader hazards.
Residents in hurricane-prone areas should monitor the map regularly during storm season. Pay attention to the forecast track, cone of uncertainty, and watch/warning areas. Use this information to make decisions about evacuations, preparations, and safety measures. The National Hurricane Center provides detailed forecasts and updates to help communities stay informed.
For example, if the map shows a storm approaching your area within 48 hours, you should secure loose outdoor items, stock up on supplies, and follow local evacuation orders if issued. Understanding the map's features and what they represent is important for making informed decisions during hurricane season.
To learn more about hurricane tracking and preparedness, explore resources from the National Hurricane Center and other trusted meteorological organizations. These tools and information can help you stay safe during hurricane season.