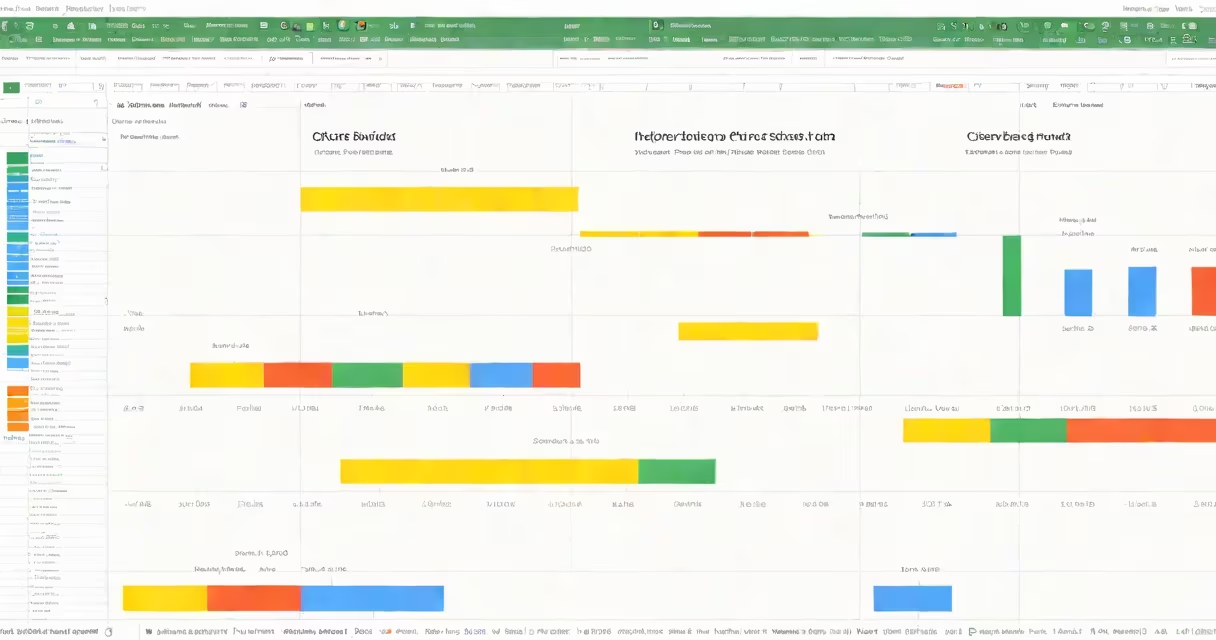
A timeline chart in Google Sheets is a bar graph that displays project tasks or events along a horizontal time axis, with each bar representing a task's duration between start and end dates. It helps visualize project schedules, track progress, and identify overlaps or gaps.
Timeline charts in Google Sheets use stacked bar graphs to represent time-based data. The x-axis shows dates, while the y-axis lists tasks or events. Each bar's length corresponds to the task's duration, with start and end dates marked. These charts often include color-coding to distinguish different phases or departments.
Google Sheets supports two primary timeline chart types:
| Type | Use Case | Key Features |
|---|---|---|
| Gantt chart | Project management | Task dependencies, percent complete markers |
| Simple timeline | Event scheduling | Start/end dates, milestones |
Gantt charts are the most common type, particularly for project management. They show task sequences, dependencies, and progress percentages. Simple timelines focus on displaying start and end dates for events without tracking dependencies.
To create a timeline chart in Google Sheets:
For Gantt charts, add a "Duration" column (end date minus start date) and use it to determine bar lengths. Google Sheets automatically calculates durations if dates are formatted correctly.
Many users confuse timeline charts with other visualizations. Timeline charts are not:
The key difference is that timeline charts specifically represent time intervals for discrete tasks or events. Another common mistake is not formatting dates consistently, which can cause the chart to display incorrectly.
For more sophisticated timelines, use additional columns to track:
Google Sheets allows you to link your timeline chart to other data sources, including Google Chrome extensions for project management tools. This creates a changing dashboard that updates automatically when project data changes.
According to Google's support documentation, timeline charts in Google Sheets can handle up to 100 tasks efficiently. For larger projects, consider breaking the timeline into phases or using multiple sheets linked together.