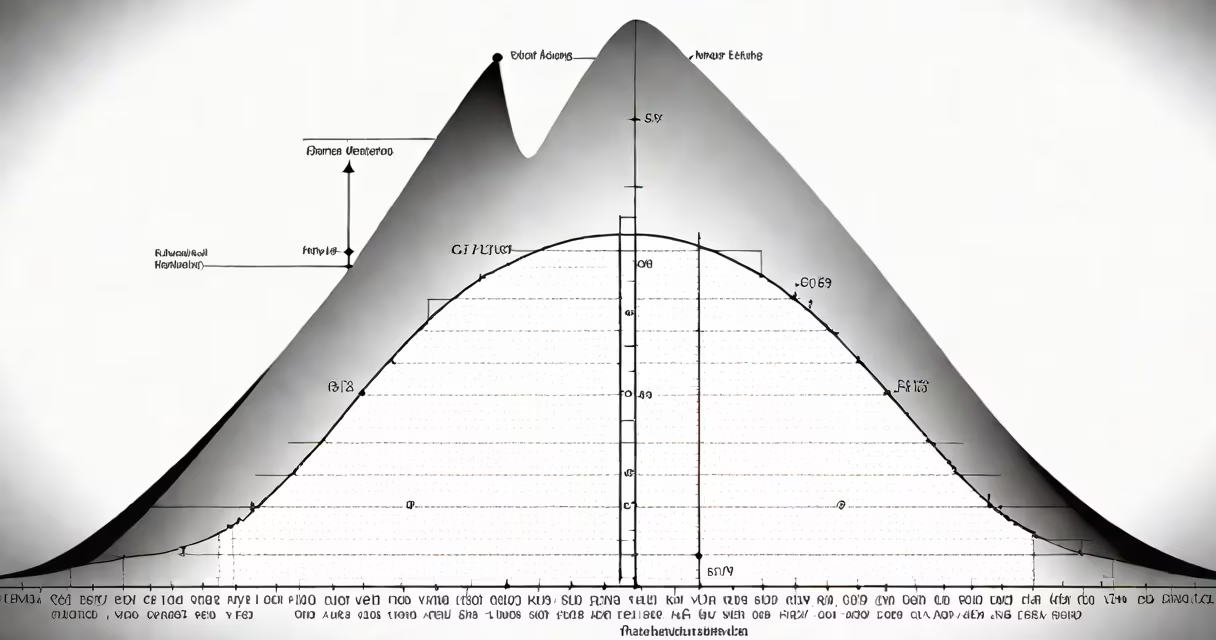
A normal distribution probability calculation estimates the likelihood of data points falling within specific ranges of a symmetric, bell-shaped distribution. This process relies on the mean, standard deviation, and properties of the normal distribution.
The normal distribution, also called the Gaussian distribution, models many natural phenomena like heights, test scores, and measurement errors. Its probability density function defines the likelihood of values occurring around the mean (average).
To calculate probabilities, you convert values to z-scores using the formula:
z = (x - μ) / σ
Where x is the value, μ is the mean, and σ is the standard deviation. Z-scores show how many standard deviations a value is from the mean.
Probability calculations for normal distributions fall into three categories:
For example, calculating the probability that a randomly selected person's height falls between 65 and 70 inches requires a range probability calculation.
Normal distribution probability calculations appear in quality control, finance, psychology, and biology. They help assess risks, set confidence intervals, and make data-driven decisions.
In manufacturing, engineers use these calculations to determine acceptable product variation. In education, they evaluate student performance relative to peers. According to the Central Limit Theorem, even non-normal data often approximates normal distributions when sampled sufficiently.
Many confuse normal distributions with uniform distributions, which have equal probabilities across all outcomes. Unlike uniform distributions, normal distributions concentrate probabilities near the mean.
Another mistake is assuming all real-world data follows a normal distribution. While common, some data sets are skewed or have multiple peaks.
Suppose test scores follow a normal distribution with a mean (μ) of 70 and a standard deviation (σ) of 10. To find the probability of scoring between 60 and 80:
This means 68.26% of students score between 60 and 80.
I once used this method to analyze survey responses about customer satisfaction. By calculating probabilities within specific score ranges, I identified which factors most influenced ratings.
For more practical applications, explore real-world examples of normal distributions.