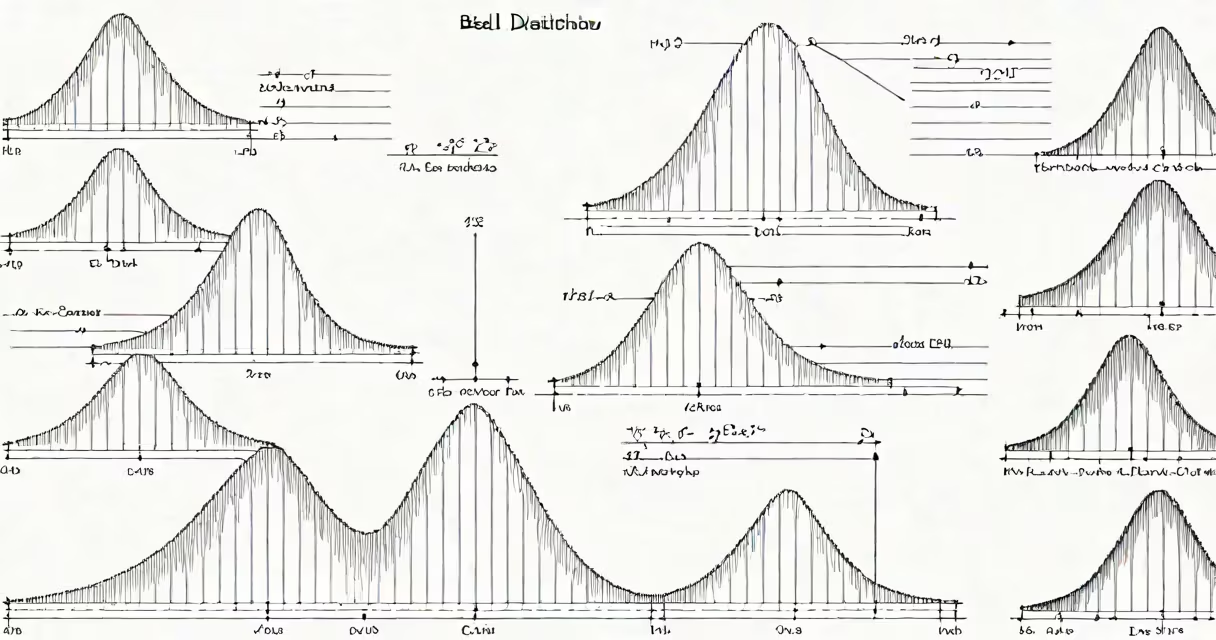
A normal distribution is a continuous probability distribution where data clusters symmetrically around a central peak, forming a bell-shaped curve. This occurs when most values fall near the mean, with fewer values appearing farther away.
The distribution is defined by two parameters: the mean (average) and standard deviation (spread). About 68% of values fall within one standard deviation of the mean, 95% within two, and 99.7% within three.
For example, if the average height of adult men is 5'9" with a standard deviation of 3 inches, about 68% of men will be between 5'6" and 5'12".
While all normal distributions share the same basic shape, they differ in their mean and standard deviation. Some key variations include:
| Type | Mean | Standard Deviation | Example |
|---|---|---|---|
| Standard Normal Distribution | 0 | 1 | Standardized test scores |
| Non-Standard Normal Distribution | Any value | Any positive value | Human heights, IQ scores |
Normal distributions appear in many natural and man-made processes due to the Central Limit Theorem, which states that the sum of many small independent effects tends toward a normal distribution.
Common examples include:
Many people confuse normal distributions with other types of distributions. For instance, exponential distributions (which model time between events) are often mistaken for normal distributions.
Another mistake is assuming all data is normally distributed. In reality, many datasets are skewed or have multiple peaks.
Consider the heights of adult women in the United States. The average height is about 5'4" with a standard deviation of 2.5 inches.
Using the properties of normal distributions:
This pattern holds true because height is influenced by many small genetic and environmental factors, fitting the conditions of the Central Limit Theorem.
For example, to find the percentage of women taller than 5'7" in our height example, you would calculate the z-score and look up the corresponding probability.
Understanding normal distributions helps in various fields. In quality control, it ensures products meet specifications. In medicine, it helps determine healthy ranges for important signs. In finance, it aids in risk assessment.
By recognizing normal distributions, you can make better predictions and decisions based on data.