A continuous variable is a measurable quantity that can take any value within a range, unlike discrete variables limited to specific counts. These variables represent measurements where values between two points are meaningful.
Continuous variables operate on a scale where increments are infinitely divisible. For example, time can be measured in seconds, milliseconds, or even smaller fractions. This contrasts with discrete variables, which count distinct items like the number of students in a class.
While all continuous variables share the core characteristic of infinite divisibility, they can be categorized based on their distribution:
For example, body temperature is an interval variable because a difference of 1 degree is consistent, but 0 degrees doesn't mean the absence of temperature. Height is a ratio variable because it includes a true zero point.
Continuous variables appear in scientific research, engineering, economics, and daily life. Scientists use them to measure physical phenomena like light intensity or sound waves. Economists track continuous variables such as GDP growth rates or inflation indices. In healthcare, continuous variables include blood pressure readings and cholesterol levels.
These variables are essential for statistical analysis because they allow for more precise calculations and predictions. Researchers often use continuous variables in regression models to identify relationships between different factors.
Many people confuse continuous variables with large discrete variables. For instance, while the number of cars passing through an intersection might seem continuous, it's actually discrete because you can't have a fraction of a car. Another misconception is that all measurements are continuous, but some, like shoe sizes, are discrete categories.
According to the Nature Education, continuous variables require careful handling in statistical tests to avoid errors in interpretation.
Consider measuring room temperature. A thermometer can show 72.3°F, 72.31°F, or even 72.315°F. The decimal points can continue indefinitely, demonstrating the continuous nature of temperature. This precision allows scientists to detect subtle changes in environmental conditions.
In contrast, if you were counting the number of people in a room, you couldn't have 15.3 people. This discrete count represents a different type of variable entirely.
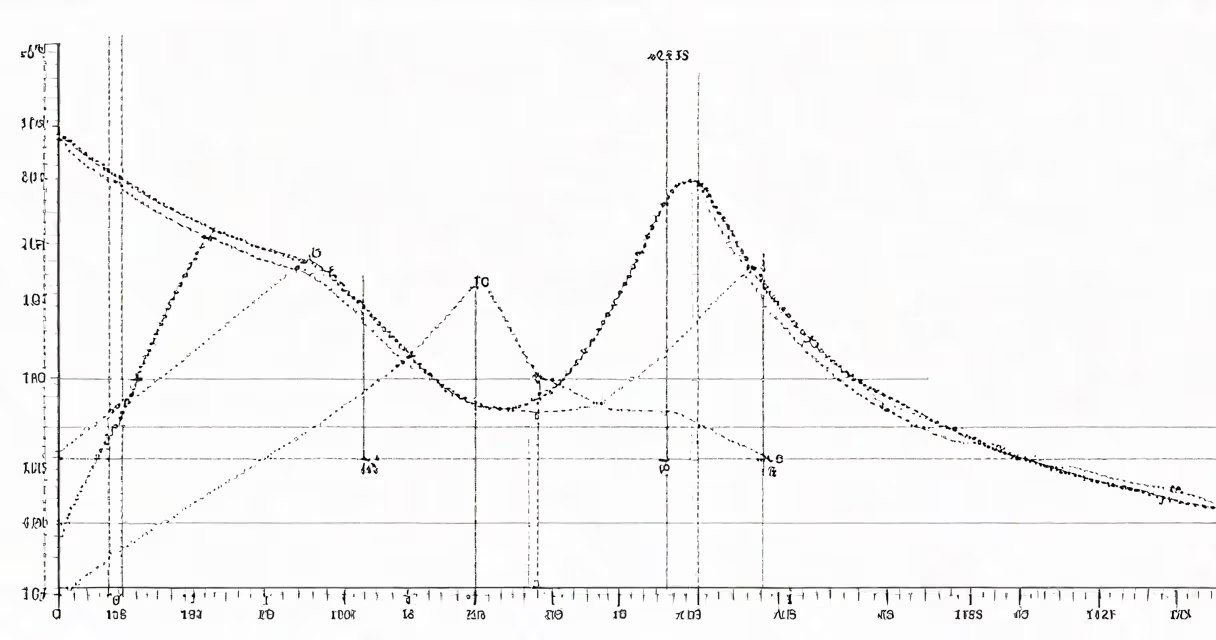
Graphs like histograms or line charts effectively display continuous data. A histogram shows the distribution of data points, while a line chart tracks changes over time. For example, a line chart tracking daily temperature changes would show continuous variation throughout the week.
The Statistics How To website provides excellent examples of how to visualize continuous data effectively.
In manufacturing, continuous variables help maintain product quality. Machines monitor dimensions of products, ensuring they fall within acceptable ranges. For instance, a machine producing metal rods might measure their diameter continuously, rejecting any rod outside the specified tolerance.
This process ensures consistency and reduces defects, saving companies money and enhancing customer satisfaction. By analyzing these continuous measurements, manufacturers can identify trends and make adjustments to improve production efficiency.
Understanding continuous variables is important for accurate data analysis and interpretation. These variables provide the precision needed for detailed scientific research, economic modeling, and quality control in manufacturing. By recognizing the differences between continuous and discrete variables, researchers and analysts can make more informed decisions and draw accurate conclusions from their data.