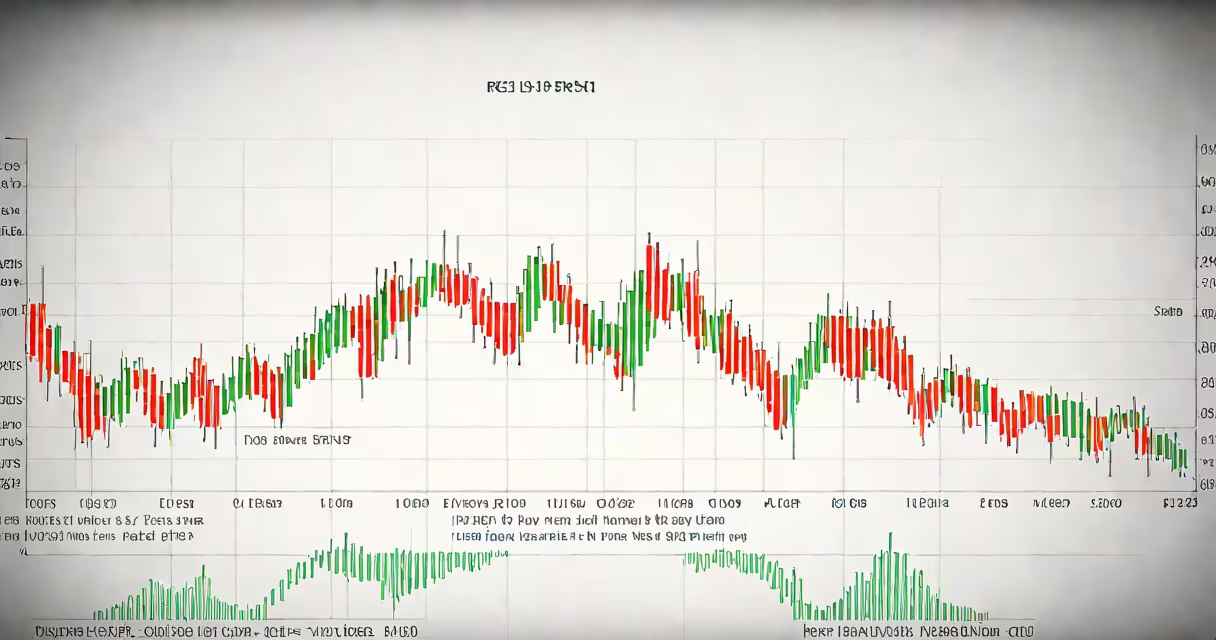
The relative strength index (RSI) is a momentum oscillator measuring the speed and change of price movements, ranging. It identifies overbought (above 70) or oversold (below 30) conditions using a 14-period default setting.
Developed by J. Welles Wilder Jr., the RSI compares recent gains to recent losses over a specified period. When prices close higher than previous highs, they contribute to average gains. Closes lower than previous lows contribute to average losses.
The RSI formula involves several steps:
While the standard RSI uses a 14-day period, traders adjust settings for different strategies:
| Type | Period | Use Case |
|---|---|---|
| Standard RSI | 14 | General trend analysis |
| Short-term RSI | 5-9 | Day trading, scalping |
| Long-term RSI | 20-50 | Position trading, swing trading |
RSI also helps identify failure swings, where momentum shifts against the prevailing trend. A bullish failure swing occurs when RSI makes a lower low but the price makes a higher low, suggesting upward momentum.
Many traders mistakenly believe RSI predicts future price movements. However, it measures current momentum, not future trends. RSI can stay overbought or oversold for extended periods in strong trends, leading to false signals.
Another misconception is that RSI levels are absolute. While 70 and 30 are common thresholds, traders adjust these based on market conditions and asset volatility. For instance, a highly volatile cryptocurrency might have an RSI threshold of 80 for overbought conditions.
In April 2023, Tesla's stock showed an RSI of 72 after a strong rally. The next week, the RSI dropped to 65 as the price corrected by 5%. This move suggested the stock was no longer overbought, and traders who waited for the RSI to fall below 70 avoided selling too early.
Similarly, in June 2023, Amazon's RSI hit 28 during a market-wide sell-off. The following week, the RSI rose to 35 as the stock rebounded 4%. Traders using RSI identified the oversold condition and entered long positions before the recovery.